[T6_measured] Monitoring DPF regeneration, DPF condition, EGR operation

Looking forward to your report View attachment 204195

Well no reports or conclusions as of yet but here's the raw data.

Recorded VDCS logging, Raspberry PI sniffing OBD port and CANEdge2 behind the gateway. I've made no attempt to match timestamps - the logs are of different lengths as it's practically not possible to start them at the same time.

The sequence was:
* Turn on CANEdge2
* Set up Raspberry
* Set up VCDS

In the UDS grouped versions, you see little bit of ungrouped queries in the file start as setting up VCDS takes little bit of time and others were already recording at that point.

Raspberry versions are just everything from OBD port so there might be some mixed control messages. CANEdge2 versions on the other hand have been filtered down to just 7E0/7E8 messages.

As the point was to look at grouped requests, the data itself is not interesting in this particular case - this was just idling on my drive.

VCDS ungrouped sample rate about 0.8Hz, 6-7Hz when running grouped by 7. This is running VCDS in VMWare Fusion in MacBookPro Intel 2019. I also tested Bypass Windows Timers -option, seemed to work as well and upped the sample rate to about 9.3Hz. But as that is not supposed to affect communications I didn't log any data when it was on.

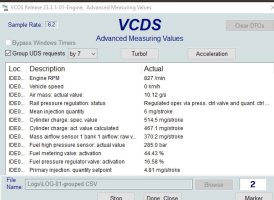
ungrouped.jpggrouped.jpg
 

Attachments

  • raspberry-ungrouped.txt
    85.1 KB · Views: 2
  • raspberry-grouped.txt
    366.9 KB · Views: 3
  • vcds-ungrouped.csv
    7.1 KB · Views: 3
  • vcds-grouped.csv
    43 KB · Views: 5
  • canedge2-ungrouped.csv
    61.7 KB · Views: 1
  • canedge2-grouped.csv
    279.7 KB · Views: 5
Wasn't too difficult :whistle:

UDS grouped request
Code:
16.4722000000000008;7E0;10 19 22 58 52 44 5F 44       - First Frame 25 (0x19) bytes to follow
                                                      - Service 0x22
                                                      - Followed by list of 2 byte PIDs
16.4724499999999985;7E8;30 0F 05 AA AA AA AA AA       - Flow control response from ECU
16.4830499999999986;7E0;21 5E 44 60 44 C9 43 67       - Consecutive Frame 1 (0x21)
                                                      - 2 byte PID list continues
16.4981499999999990;7E0;22 43 2F 20 97 20 70 F4       - Consecutive Frame 2 (0x22)
                                                      - 2 byte PID list continues
16.5129500000000000;7E0;23 10 F4 0D F4 0C 55 55       - Consecutive Frame 2 (0x22)
                                                      - 2 byte PID list continues
                                                      - Padding bytes 0x55 to even 8 byte frame

UDS grouped response
Code:
18.7005999999999979;7E8;10 1D 62 58 52 01 F7 44       - First Frame, 29 (0x1D) bytes to follow
                                                      - Service 0x62 = response to service 0x22
                                                      - Followed by a list of 4 byte responses in the 
                                                        same order they were asked for 
18.7030499999999975;7E0;30 00 01 55 55 55 55 55       - Flow control response from VCDS                                                        
18.7032999999999987;7E8;21 5F 06 69 44 5E 11 34       - Consecutive Frame 1 (0x21)
18.7056000000000004;7E8;22 44 60 0B 4A 44 C9 0E       - Consecutive Frame 2 (0x22)
18.7076499999999974;7E8;23 93 43 67 12 73 43 2F       - Consecutive Frame 3 (0x23)
18.7093999999999987;7E8;24 14 0B AA AA AA AA AA       - Consecutive Frame 4 (0x24)
                                                      - Padding bytes 0xAA to even 8 byte frame

So... pretty straightforward. The interesting thing here is that ECU responds with flow control response almost immediately. However, the actual responses start to flow only couple of seconds after the first query and VCDS just keeps bombing the same queries meanwhile like there's no tomorrow :D
 
The interesting thing here is that ECU responds with flow control response almost immediately. However, the actual responses start to flow only couple of seconds after the first query and VCDS just keeps bombing the same queries meanwhile like there's no tomorrow :D

Ah right, silly me. The responses start to flow only after I switched the grouping to 7 - ECU didn't respond trying to query all 12 PIDs at once. So the actually working first query is
Code:
18.6731999999999978;7E0;10 0F 22 58 52 44 5F 44       - First Frame 15 (0x0F) bytes to follow
                                                      - Service 0x22
                                                      - Followed by list of 2 byte PIDs
18.6734499999999990;7E8;30 0F 05 AA AA AA AA AA       - Flow control response from ECU
18.6840499999999992;7E0;21 5E 44 60 44 C9 43 67       - Consecutive Frame 1 (0x21)
                                                      - 2 byte PID list continues
18.6990499999999997;7E0;22 43 2F 55 55 55 55 55       - Consecutive Frame 2 (0x22)
                                                      - 2 byte PID list continues
                                                      - Padding bytes 0x55 to even 8 byte frame
 
Last edited:
So, @mmi, looking at how requests / responses are structured I thing you should be able to up PIDs from 12 to 14 13 without any loss in efficiency - it’s now doing 7 and 5 repeatedly; no reason why 7 and 7 6 wouldn’t work.

Also, if ECU responds to grouping by 8 at least from protocol perspective 16 PIDs (8 and 8 repeatedly) should be fine without actually moving any more bits on the bus.

Edit: obviously too tired already, 13 PIDs should work without change in efficiency
 
Last edited:
  • Love
Reactions: mmi
So, @mmi, looking at how requests / responses are structured I thing you should be able to up PIDs from 12 to 14 without any loss in efficiency - it’s now doing 7 and 5 repeatedly; no reason why 7 and 7 wouldn’t work.

Also, if ECU responds to grouping by 8 at least from protocol perspective 16 PIDs (8 and 8 repeatedly) should be fine without actually moving any more bits on the bus.
Thank you very much for having a deeper look into this. Now as you have said all the above many of my observations about recording speed behaviour have got explanation :inlove:

And, the limit of 12 measurement value is obviously a remnant from older controllers. I guess Ross-Tech is a bit reluctant to abandon their tools compatibility with older controllers.

Perhaps a concerted push on RT for the feature would work... :sneaky:
 
Yeah sorry my eyes are bit crossed this time of day/night and edited to correct only 13 PIDs without changing number of bits on the bus.

But the timings are kinky - I’ve stumbled on this with CANEdge as well, timing resolution is 10ms which is basically eternity in the age of fast hardware.
 
And, the limit of 12 measurement value is obviously a remnant from older controllers. I guess Ross-Tech is a bit reluctant to abandon their tools compatibility with older controllers.

Perhaps a concerted push on RT for the feature would work... :sneaky:

:laugh: Maybe… but let’s make sure we understand the actual achievable limits first.

In the other thread I saw data loss somewhere in between 100 to 200 PIDs / s with no VCDS involvement, and I don’t yet have an explanation. My gut feeling is that there’s some load protections built into CAN link layer and it’s not really about the software. Makes sense to request for more only after we know for sure they would be technically able to up their game.
 
<TEASERMODE>

*Very* early results but I can confirm the following:
  • ECU accepts 8 pids in UDS group request
  • There's no technical limitation, at least wrt to this particular ECU, why VCDS could not do 8/8 as well. Probably would improve speed but not sure how much.
  • Using UDS group requests, I can read up to 200 PID/s from CANEdge :whistle:
Regarding CANEdge, might improve still in the future, this is currently mostly a limit of configuration structure.

</TEASERMODE>

Then, the caveats:
  • Only 8 PIDs @25Hz each or 40 PIDS @5Hz each are stable good quality setups with CANEdge. Others are possible but sample intervals would not be evenly spaced.
  • As of today, none of the existing software handles ISO-TP multiframe responses. Not DBC syntax, not MDF file, not asammdf. However, I'm a man with a plan and I *think* I can solve this issue some time next fall
 
Last edited:
Just did mine at idle and with some rpm, I'm quite confused at the difference between mine and yours

1689443509672.png
 
  • Like
Reactions: mmi
Aha - the log snippet was recorded in late December before engine was started - thus subfreezing temperetures - basically logged ambient temperature.
ahah I get it, I am performing an analysis currently (that I can gladly provide so you can use it). And again thanks for the torque settings its very helpful

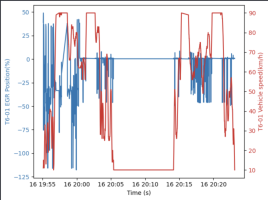
Another strange thing I have compared to you, is the range of EGR position.

My EGR is brand new but mine seems to have a max of 49 compared to your 118. :

1689537238421.png

And here is a chart with data only when in motion :
1689538448270.png
 
Last edited:
  • Like
Reactions: mmi
My EGR is brand new but mine seems to have a max of 49 compared to your 118. :
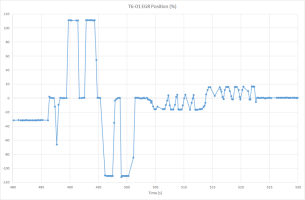
Oh, just realized that earlier I was referring to wrong log re the subfreezing exhaust temps. In the second log there is grayed area noting a time leap - thus in the log are only the beginning and the end of the full 33 minute journey (30 minutes hidden in grayed bar).

Based on the position value the EGR seems to "two-sided" - even during travel it every now and then flips sides (e.g. from negative to positive, and back).

Perhaps easiest way to observe minimums and maximums is to let engine shut off by stop/start - the EGR will do a few full sweeps and quite a few smaller ones :cool:

1689541741207.png
Engine shut-off at 486 seconds - where EGR jumps to 0
 
Oh, just realized that earlier I was referring to wrong log re the subfreezing exhaust temps. In the second log there is grayed area noting a time leap - thus in the log are only the beginning and the end of the full 33 minute journey (30 minutes hidden in grayed bar).

Based on the position value the EGR seems to "two-sided" - even during travel it every now and then flips sides (e.g. from negative to positive, and back).

Perhaps easiest way to observe minimums and maximums is to let engine shut off by stop/start - the EGR will do a few full sweeps and quite a few smaller ones :cool:

View attachment 206117
Engine shut-off at 486 seconds - where EGR jumps to 0
Just did it again with some start and stop, and it seems it never goes above 80 on the positive side. I wonder if the EGR sensor is in good condition. Anyway I am aware it is not the topic of this thread, I'll try to post clean data and my script to automate the processing of the data to provide good indicators (I am a data scientist and I find it really fun to explore car data).
I think that would be beneficial to have data from several T6 in order to build acceptable ranges of whatever indicator, and the more data we have, the more we can do (wear prediction, problem finding, etc...)
 
ahah I get it, I am performing an analysis currently (that I can gladly provide so you can use it). And again thanks for the torque settings its very helpful

Another strange thing I have compared to you, is the range of EGR position.

My EGR is brand new but mine seems to have a max of 49 compared to your 118. :

View attachment 206102

And here is a chart with data only when in motion :
View attachment 206104

(I am a data scientist and I find it really fun to explore car data)

Wildly OT but is that a whiff of Python / matplotlib I sense?

Any tips for plotting more than 2 signals on same graph? I've been in a search of library that could do multiple axes - I know it's considered bit of a bad practice but would be very useful for building automation or notebooks around signal analysis. Especially overlaying some discrete signals with ease would be just awesome.

And I'm not a data scientist, just taking first steps on Python and R basically (VW T6 Custom PID codes for DPF) but intrigued by data collection, analysis and automation of them anyway :think smile bounce:
I'll answer to you in private if you don't mind, I don't want to pollute the thread with technical stuff. I'll post my notebook when I find time to make it clean though
 
Wildly OT but is that a whiff of Python / matplotlib I sense?

Any tips for plotting more than 2 signals on same graph? I've been in a search of library that could do multiple axes - I know it's considered bit of a bad practice but would be very useful for building automation or notebooks around signal analysis. Especially overlaying some discrete signals with ease would be just awesome.

And I'm not a data scientist, just taking first steps on Python and R basically (VW T6 Custom PID codes for DPF) but intrigued by data collection, analysis and automation of them anyway :think smile bounce:
Yes it is ! To add more axis you can just add as many as you want, here is an exemple :


Python:
# Plotting 'T6-01 EGR Position(%)' with respect to time 'Device Time'
color = 'tab:blue'
ax1.set_xlabel('Time (s)')
ax1.set_ylabel('T6-01 DPF Differential pressure(mbar)', color=color)
ax1.plot(df['Device Time'], df['T6-01 DPF Differential pressure(mbar)'], color=color)
ax1.tick_params(axis='y', labelcolor=color)

# Creating a second y-axis to plot 'T6-01 Engine RPM(1/min)' with respect to time 'Device Time'
ax2 = ax1.twinx()
color = 'tab:red'
ax2.set_ylabel('T6-01 Engine RPM(1/min)', color=color)
ax2.plot(df['Device Time'], df['T6-01 Engine RPM(1/min)'], color=color)
ax2.tick_params(axis='y', labelcolor=color)

#creating a third axis to plot 'T6-01 Vehicle speed(km/h)' with respect to time 'Device Time'
ax3 = ax1.twinx()
color = 'tab:green'
ax3.set_ylabel('T6-01 Vehicle speed(km/h)', color=color)
ax3.plot(df['Device Time'], df['T6-01 Vehicle speed(km/h)'], color=color)
ax3.tick_params(axis='y', labelcolor=color)

# A good practice is to make the spacing around the plot tight so that everything fits
fig.tight_layout()
plt.show()
 
Back
Top