VW T6 Custom PID codes for DPF

Put above together and I think I'm looking into some kind of a sub bus of drivetrain CAN currently, although the wire colours match. Maybe I'm not seeing the full depth of the drivetrain CAN? Perhaps ECU is acting as a gateway in this case as the DPF control unit is located underside of the vehicle? I suppose I need, in the name of the science of course, do some more wire work... the way to go is to take a temporary wiring from a known good drivetrain CAN and see if I get different results from there. Very eager to validate if my suspicions are right but unfortunately I probably don't have a chance to jump on this until next week earliest :(

Live and learn I guess, I was indeed fooled by the evil Delphi monster dcm6.2 dwelling in my e-box. Having now connected to a real drivetrain CAN instead of a watered down one, the difference in amount of captured data is nothing but staggering. On my May 14th run, I saw roughly 10k msg / minute on the drivetrain CAN. Just idling for a bit, no test runs yet, and I'm now looking at 124k msg / minute. And 79 active PID's on the bus as opposed to only 6 before o_O. I guess I have next winter sorted.

Learning:
  • Drivetrain CAN (orange/black, orange/brown) is not really the same all around the vehicle - if you tap into the drivetrain CAN from under the seat or the floor channel under the gear stick, you are actually tapping into a sub bus that might or might not work depending on a use case
There, I Fixed it! Ok, maybe I need a better wire run than just a non-twisted pair over the gear stick :laugh:

1685559408296.png

1685559478288.png
 
Now that I have my data collection volumes about where they will be it's time to estimate storage costs over time.

I'm using Amazon S3 Frankfurt region and storage there costs $0.0245 per GB of data in month (in standard access tier meaning data is available quickly and is really resilient).

My data collection now produces about 2.5MB per running minute raw binary .mf4 file format data. These files are stored to S3 and can be directly loaded into the analysis tools, eg freely available asammdf (asammdf GUI/API - Easily DBC Decode & Plot MF4 CAN Bus Data), that's the one from which I've got the screenshots earlier in the thread.

Assuming 60 km/h average speed we also get 2.5MB / km. Of course the average speed varies by the driving environment but I guess it's safe to say overall average would vary between 30 km/h - 90 km/h, so I think 60km/h is a good compromise. Real life cost based on this estimation will thus vary 0.67x - 2.0x (going faster means less storage $/km and 60/90 = 0.67) of the ballpark figure. 10k km of recorded data, stored in full, would mean 25GB of raw data and the monthly cost of storage would be 0,6125 USD. Of course this accumulates and thus after 100k km I would pay 6,1 USD / month - still fairly tolerable, I think, for the volume.

CANEdge2 is able to compress the data before storage. This should result in > 50% of size (and cost) savings. However, I'm hesitant of using this feature as the data has to then be decompressed before using and thus analysis will require more tooling and slow down the workflows.

Also, Amazon offers different storage tiers through which the storage cost can be reduced significantly. Above cost is for storage only, accessing the data brings separate costs. The different tiers either compromise on data resilience or speed or cost of accessing the data - however as I'm not going to access most of the data frequently increasing access cost in order to bring down continuous storage cost might be reasonable.

Edit: fixed the multiplier math
 
Last edited:
Of course, I should have known somebody has put in lot of prior effort to interpret the CAN signals. I already earlier found a DBC file for Golf MK4 [1] - DBC files are what are used to hold recipes of how the raw CAN data translates to human readable signals. However, as I didn't have the correct drivetrain CAN recorded at that point, I didn't get much anything sensible out using that DBC file and just ignored it.

Well, now the DBC file works much better and there's a bunch to look at. The file is unfortunately in German, not my strongest, and it's not like all signals described actually work. Also the file probably is far from complete. Anyway, it still is a treasure trove and makes much of my investigations easier - some of the work will be just translation and filtering out signals that do not work or don't seem meaningful. There's so much that using the file as is will drown me on data points out which only a small part I consider useful or interesting.

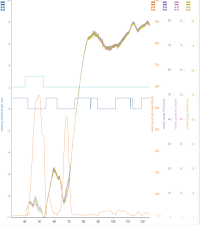
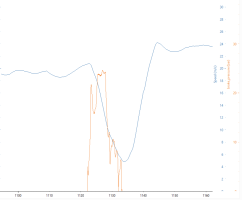
Anyway, these are the very first but already nice results from using the file. As an example, I reversed while turning steeply left and then drove on slowly to nearby junction, then another left turn and acceleration. I plotted steering wheel angle in grads (orange) against individual wheel speeds. Neither metric includes sign natively so we have separate sign signals (light blue for wheel rotation direction, high is reverse and dark blue for steering wheel angle, left = low, right = high). Wheel speeds naturally are very close to each other except when steering wheel angle is high - the outer wheels have to travel faster so the speeds deviate.


1685785795471.png

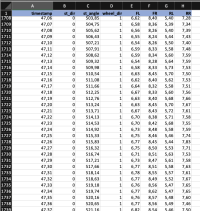
Getting the recorded data out in CSV format is fairly straightforward as well - this can be useful for usage in Excel or other software. However, a separate file will be produced for each metric. This is because each metric will have timestamps of the message so the metrics will not be neatly aligned to any particular time intervals. Resamplling the data on export is possible, this way multiple metrics can be imported into a single excel sheet and have timestamps aligning nicely. For example, here's a piece of the above data in excel, resampled to 100Hz. These both metrics are actually produced with 100Hz frequency so interpolation to the 0.01s steps will not distort the data too much.

1685791757249.png

[1] opendbc/vw_golf_mk4.dbc at master · commaai/opendbc
 
Couple of interesting data points

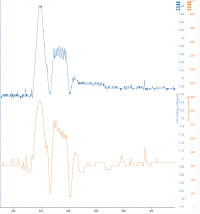
1. Alternator power in watts. Interestingly, this also shows regenerative production.

1685957319660.png


2. Brake pressure in bars - need to test little bit more but I think this pretty much directly is the braking force applied to pedal

1685957696055.png


Some others too like I finally found the running gear but it's little bit weird, I need to test more to be sure of the value vs actual gear. And some torque values, light sensor, cranking signal etc.

Overall, I think I now have pretty good coverage of the metrics relating to the vehicle motion, kind of "Freeze frame on steroids", at any point in time. However, still lacking a lot in the engine sensor department... I think I need to shift focus a little bit now for a while and see what I can do by querying some exact sensors. That way I can guarantee I have some interesting ones in the data as early as possible - if some of those are later discovered to be extractable from the default CAN dump it's not a problem, then I just drop querying and switch to use the discovered one.

What would be the top 10 measurements to track? I haven't yet browsed through advanced measuring blocks with that eye but some ideas would be
  • fuel rail pressure
  • injection timing
  • cyl 3 pressure sensor
  • egr valve pos
  • exhaust temperatures in egr, dpf
  • crank / cam timing?
  • awd coupling %
Some of them, especially timings, might require too high frequency to get a nice signal but let's see. I think for my purposes it would be enough to sample on lower frequency, this would still make it possible to detect if they start to wander off their typical ranges.
 
An interesting tidbit of information is that if you query custom PID's from CarScanner, like 7E0 22208B for soot mass calculated, what happens in behind scenes is that the gateway broadcasts this request both to drivetrain and convenience CAN. The response is then only present in the bus where the responding control unit is. This is why I earlier did see the queries in convenience CAN but not the responses that I knew should be there. Probably not very important, but this might help a bit in avoiding overloading the buses as doing custom queries from CANEdge2 can be targeted only to the known correct bus instead of broadcasting to all buses.

I haven't yet made any custom queries from CANEdge2 but I figured out the DBC file syntax for extracting custom query signals. That is, I can now read the data that I have on my CarScanner dashboard also from the long term storage dumps and extraction of query data from CANEdge2 will be similar. So, I don't need to separately ask for aux battery voltage or soot mass calculated as CarScanner dashboard does the querying.

As many different queries might be present in the response channels such as 7E8 we have to recognise custom PID from the actual response data and then give a name to extracted signal. In DBC nomenclature, this is called multiplexing. To use multiplexing in DBC, we first define the bits where to identify different response types from - in the below example this would be 'MultiplexIndexSignal'. Capital M tells asammdf to treat this particular signal as multiplex type selector. Then, to extract the different responses we define a new signal for each pid value with lower case m followed by the pid in decimal - when a response is seen in 7E8 channel and matching one of the signal values in bits defined by MultiplexIndexSignal, it's earmarked with the corresponding signal name and converted according to it's specific conversion rules.

Code:
BO_ 2024 polling_0x7E8: 8 Vector__XXX
    SG_ MultiplexIndexSignal M : 15|24@0+ (1,0) [0|0] "" Vector__XXX
    SG_ soot_mass_calculated m6430859 : 39|16@0+ (0.01,0) [0|100] "g" 0x62208B
    SG_ soot_mass_measured m6430860 : 39|16@0+ (0.01,0) [0|100] "g" 0x62208C

Working with DBC's is overall little bit tricky. First, all channels and pids are processed as decimal so a hex calculator gets serious use constantly - the hex values I have written in the above definition are really just comment fields which make it easier for me to find the definitions later on, if I need to fix or double check something. Then, the syntax of which bits exactly to pick up to form the signal is quite confusing, mostly due to both little-endian and big-endian conventions used in the data. It's kind of like having left-to-right and right-to-left text mixed in a same book and the sentence start positions jump around all the time. Anyway, this is mostly just little bit tedious trial and error work, coupled with every change followed by running the data extraction again and checking what came out to the signals. In this particular case it was easy as the PIDs and conversion rules were already discovered earlier.

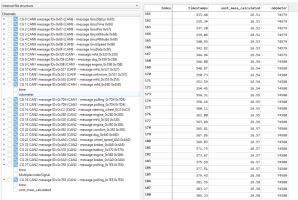
By having the multiplex definitions in place the extracted data will then look like this. I don't really have the soot_mass_measured in the data as it's not on my CarScanner dashboard - just added it as an example of multiplexing. The multiplexed signals create their own "channel groups" from which they can be picked up for tabular or plot representation.

1686211012151.png
 
Last edited:
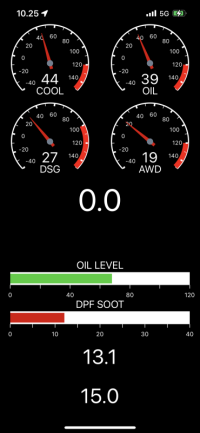
Playing with CarScanner for a change: dropped AWD clutch percentage but added oil fill level. This is actually useful since I need to top up some every now & then.

I set up the background to change to red when the level goes below 50 (mm), I think it means half of the stick range as 100 should be the top of the stick range.
Credit @mmi [T6_measured] 01-Engine - Oil pressure switches & Oil level sensor

The metric is little bit jumpy and seems to show 120 when it feels like it

IMG_3833.png
 
Last edited:
The metric is little bit jumpy and seems to show 120 when it feels like it
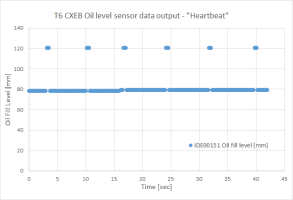
Yes, the 120 mm seems to be a kind of "heartbeat" in the data - can be seen when sample rate is high enough - otherwise indeed looks like a random thing.

1686480068866.png
 
Yes, the 120 mm seems to be a kind of "heartbeat" in the data - can be seen when sample rate is high enough - otherwise indeed looks like a random thing.

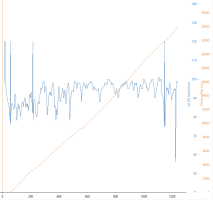
The "heartbeat" seems to be much more random when driving. Also there's really quite a bit of spread in the fill level metric - for example I noticed it dropped significantly in some tight curve. Natural, I suppose, as the oil moves around.

Also applied a firmware update to the CANEdge2 and that brought a nice new GPS metric - trip distance. This is in meters as opposed to the vehicle odometer, and being based on GPS might be more accurate. Need a bigger sample, in below snippet the GPS distance was just a tad shy of 24km whereas odometer went up 23km.

1686504997146.png
 
Ok, maybe I need a better wire run than just a non-twisted pair over the gear stick :laugh:

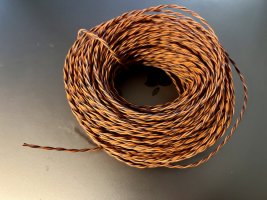
My dear friend Ali Express sent a roll of twisted pair over, accompanied by a lovely fresh scent of Chinese plastic.

Now I can clean the rough edges up. Got little bit tired of diy -twisting individual wires.

IMG_3839.jpeg
 
Small interesting observation: if I query PIDs from CANEdge2, I see their responses (7E8) in the diagnostic bus. But not the queries (7E0).

I think this means gateway just copies messages with certain ID’s, such as 7E8, to the diagnostic bus always - it doesn’t try to match requests and responses in any way.

Now I’m already considering if I could use this feature to communicate something from CANEdge2 to CarScanner :geek:
 
Flooding the CAN

I’ve been testing querying certain sensors using CANEdge2 periodical transmissions. This works nicely and makes sure I can capture, besides of all data that is present in the bus natively, some amount of PIDs (advanced measuring values in VCDS terminology) continuously.

But how many and on what frequency?

There’s a risk of overwhelming the ECU or the CAN bus itself by simply asking too much. Safety first so I set out to find out if I can flood the CAN.
  • There’s some metrics on the drivetrain bus that are 100Hz by nature - such as wheel speeds from ABS and throttle position from ECU
  • A 100Hz metric should ideally have exactly 10ms timestamp interval
  • In real life, timestamps deviate from ideal little bit and that deviation is called jitter
  • Since clock in CANEdge2 is accurate enough, down to 0.05ms, we can observe the jitter in timestamps and measure it as abs(ts(n-0) - ts(n-1) - 10ms)
  • Hypothesis: if either the ECU or the bus is congested, the jitter will increase
  • To find out the congestion point, increasing CAN load should be applied until a change in measured jitter is detected
  • If we measure jitter of two 100Hz data streams from ABS and ECU, while querying only the ECU, we should be able to differentiate between bus and control unit congestion. If jitter is increased in both data streams, bus is congested. Jitter on ECU data only points to control unit congestion.
  • Test should be carried out with multiple PIDs, it’s not known if a single PID can get congested or throttled
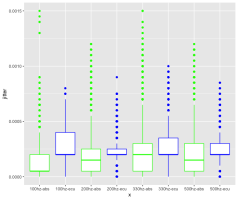
I queried for 10 ECU PIDs with 100Hz, 200Hz, 330Hz and 500Hz total frequency, eg 10 PIDs with 10Hz each results in 100 queries/s. The tests were performed with engine running, DSG selector at P and handbrake on. Here’s candlestick plots of the jitter of wheel speed (ABS) and throttle position (ECU):

ecu-jitter.png
The boxes represent two middle quartiles (25% at bottom edge and 75% at top edge) of the samples, with the majority of low/high quartiles represented as whiskers below and above the box. The dots are outliers. Here we see despite of pushing the load quite a bit from CANEdge2, the jitter remained low all the time. Even outliers sit at or below 1.5ms at all times. So, not much to learn here.

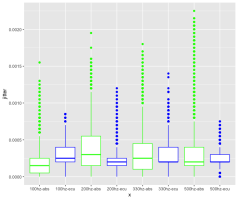
Next, instead of querying just ECU I split the queries to 5 different control units, 2 PIDs each. The overall query load is exactly the same but targets other CU’s than ECU and ABS. And the plots:

jitter.png
Not that much to learn here either, we only see little bit higher outliers - I'm not currently exactly sure why but I think querying multiple CU's made larger part of the load to be actually processed and it started to affect the bus a bit. Maybe.

While the results from this test turned out to be lacklustre, this gives me confidence in adding more periodical queries to the CANEdge2. It seems that I will not be able to break the CAN easily with the querying, and it should all hold together as long as I'm reasonable in adding metrics.

Next: analysing what happened to the actual data during above tests - I can't believe 500Hz results hold, responses must have been dropped. But that's ok, I'm fine with data dropping rather than vehicle operation affected.
 
Last edited:
Next: analysing what happened to the actual data during above tests - I can't believe 500Hz results hold, responses must have been dropped. But that's ok, I'm fine with data dropping rather than vehicle operation affected.

May warrant more accurate testing still but queried data indeed starts dropping between 100-200Hz query rate. 100Hz is fine but quite a bunch missing at 200Hz. So, this means for example 15 @5Hz + at least 25 @1Hz or less should be sustainable.
 
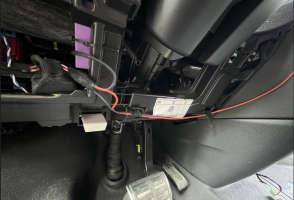
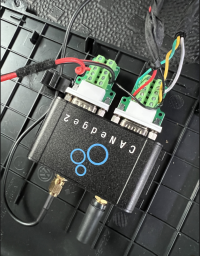
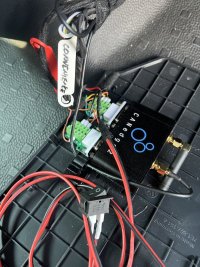
Finally got around to clean up the wiring for permanent installation. Also fitted angled wifi antenna and a power switch - not sure yet if I’ll keep the switch but it makes testing a series of config changes in a quick succession easier.

IMG_3864.jpeg

On other front I’ve been whipping up a Python program to work with MDF files. This allows me to do common operations quickly, such as combining multiple mdf files, extracting signals through applying dbc, filtering down to signals I’m looking at that time, cutting to a desired time window of interest, resampling and exporting to csv.

This might also become the basis of automation if at some point I would like to eg just get some data as mail reports automatically instead of manually looking into the actual files. It would be pretty cool to just receive ”trip diary” -style mails automatically with some simple stats, eg min/max/median coolant/oil/ambient temperatures, gear use histogram and whatever else that could be easily calculated and expressed as a simple number.
 
Playing with RStudio

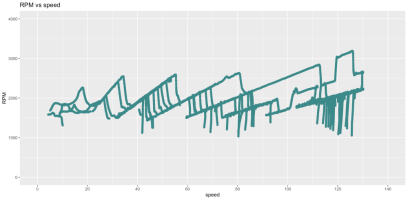
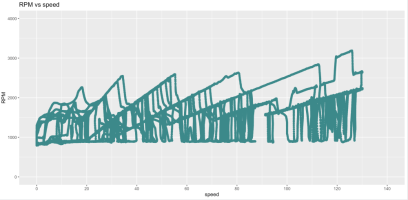
I've been trying out RStudio [1] for plotting - eg the candlestick plots earlier in the thread were produced with that. Let's see how that would work if I wanted to plot some shift curves from rpm vs speed data.

First, I'll use my Python script to extract the data as CSV's. The script is fairly simple, asammdf API [2] does the heavy lifting, my script just basically takes the command line parameters and based on those tells asammdf what to do. Here, we feed two MDF files in, extract signals using dbc filters file, filter down to three specific signals, resample to 100Hz and output CSV:
Code:
$ python3 mdf.py 00000001-649487D1.MF4 00000002-64948975.MF4 --dbc curated.dbc --channel CAN2.engine_0x280.rpm --channel CAN1.mfd_0x320.speed_actual --channel CAN1.mfd_0x320.accelerator_on --resample 0.01 --to_file data.csv --to_format csv
ldf is not supported
xls is not supported
xlsx is not supported
from          : -1
to            : -1
resample      : 0.01
dbc           : ['curated.dbc']
files         : ['00000001-649487D1.MF4', '00000002-64948975.MF4']
channels      : ['CAN2.engine_0x280.rpm', 'CAN1.mfd_0x320.speed_actual', 'CAN1.mfd_0x320.accelerator_on']
reading files...
applying dbc files...
filtering channels...
resampling...
exporting CSV...


Channels:

CAN2.engine_0x280.rpm
  unit               : U/min
  timestamps         : 232591
     first           : 0.0
     last            : 2325.8999999999505
  samples            : 232591
     first           : 819.5
     last            : 830.5
     min             : 793.25
     max             : 3189.917085424477

CAN1.mfd_0x320.speed_actual
  unit               : km/h
  timestamps         : 232591
     first           : 0.0
     last            : 2325.8999999999505
  samples            : 232591
     first           : 0.00526
     last            : 0.00526
     min             : 0.00526
     max             : 130.14661660747612

CAN1.mfd_0x320.accelerator_on
  unit               :
  timestamps         : 232591
     first           : 0.0
     last            : 2325.8999999999505
  samples            : 232591
     first           : 0
     last            : 0
     min             : 0
     max             : 1

As an output, I get summary of each channel with some quick stats like number of samples, range of timestamps and range of samples. These just help to estimate dataset size and quickly see if eg there's any outrageously high sample values. Due to resampling we have exactly same amount of samples in all channels and their timestamps all start from 0. In this example we got about 230k samples over 2300 seconds on all three channels so resampling to 100Hz seemed to work as intended.

Looking at the CSV files produced, I got just two files although I had three channels. This is because speed_actual and accelerator_on signals were from same channel group - asammdf exports by groups:
Code:
$ ls -lanh
total 228432
drwxr-xr-x@  8 501  20   256B Jun 25 10:42 .
drwxr-xr-x  28 501  20   896B Jun 24 18:24 ..
-rw-r--r--   1 501  20    50M Jun 22 20:41 00000001-649487D1.MF4
-rw-r--r--   1 501  20    44M Jun 22 20:48 00000002-64948975.MF4
-rw-r--r--   1 501  20    13K Jun 24 18:35 curated.dbc
-rw-r--r--   1 501  20   7.1M Jun 25 10:29 data.ChannelGroup_0_CAN2_-_message_engine_0x280_0x280.csv
-rw-r--r--   1 501  20   8.9M Jun 25 10:29 data.ChannelGroup_1_CAN1_-_message_mfd_0x320_0x320.csv
-rw-r--r--   1 501  20   6.5K Jun 25 10:08 mdf.py

The contents of CSV will look like this:
Code:
$ head data.ChannelGroup_1_CAN1_-_message_mfd_0x320_0x320.csv
timestamps,CAN1.mfd_0x320.speed_actual,CAN1.mfd_0x320.accelerator_on
0.0,0.005260000005364418,0
0.009999999999999787,0.005260000005364418,0
0.019999999999999574,0.005260000005364418,0
0.02999999999999936,0.005260000005364418,0
0.03999999999999915,0.005260000005364418,0
0.049999999999998934,0.005260000005364418,0
0.05999999999999872,0.005260000005364418,0
0.06999999999999851,0.005260000005364418,0
0.0799999999999983,0.005260000005364418,0

RStudio, or R statistical language in general, is pretty nice for working with data and plotting as you describe both the data manipulations and graphs as text commands on a command prompt. This allows, for example, graph "recipes" to be simply copied and pasted, yet repeatable graphs can be produced anywhere. I'm a complete noobie on these and basically just learning stuff on the go in the search of optimum workflow.

So, let's first load the CSV files in to R. To do this, we first need to install and load the libraries we're going to use: readr [3] for CSV reading and ggplot2 [4] for plotting. Installing the libraries needs only to be done on the first go, later on it's enough to just library() command to load them. As the CSV export produced rather elaborate column names let's also rename the columns for easier use:
Code:
> install.packages(readr)
> install.packages(ggplot2)

> library(readr)
> library(ggplot2)
>
> rpm <- read_csv("/<FULL PATH>/data.ChannelGroup_0_CAN2_-_message_engine_0x280_0x280.csv")
Rows: 232591 Columns: 2                                                                    
── Column specification ──────────────────────────────────────────────────────────────────────
Delimiter: ","
dbl (2): timestamps, CAN2.engine_0x280.rpm

ℹ Use `spec()` to retrieve the full column specification for this data.
ℹ Specify the column types or set `show_col_types = FALSE` to quiet this message.
>
> speed <- read_csv("/<FULL PATH>/data.ChannelGroup_1_CAN1_-_message_mfd_0x320_0x320.csv")
Rows: 232591 Columns: 3                                                                    
── Column specification ──────────────────────────────────────────────────────────────────────
Delimiter: ","
dbl (3): timestamps, CAN1.mfd_0x320.speed_actual, CAN1.mfd_0x320.accelerator_on

ℹ Use `spec()` to retrieve the full column specification for this data.
ℹ Specify the column types or set `show_col_types = FALSE` to quiet this message.
>
> colnames(rpm)[2] = "rpm"
> colnames(speed)[2] = "speed"
> colnames(speed)[3] = "accelerator_on"

After having the datasets loaded, I can combine these to a single table joining by the timestamp. This is strictly not necessary, separate datasets can be used as well but it's kind of easier to work with all data in a same table. Just entering the table name will show some rows so we can see what the data looks like:
Code:
> my_data <- merge(rpm, speed, by='timestamps')
> my_data
    timestamps      rpm   speed accelerator_on
1         0.00 819.5000 0.00526              0
2         0.01 815.0000 0.00526              0
3         0.02 815.0000 0.00526              0
...
248       2.47 827.7500 0.00526              0
249       2.48 822.8500 0.00526              0
250       2.49 822.7500 0.00526              0
 [ reached 'max' / getOption("max.print") -- omitted 232341 rows ]

Now, since I have coasting I know my graph will be little bit messed up if I plot the coasting parts. That's why I picked the accelerator_on column - we can now filter away sample rows where the accelerator was 0 (not pressed):
Code:
> my_data2 <- my_data[my_data$accelerator_on > 0,]
> my_data2
     timestamps      rpm    speed accelerator_on
5001      50.00 1664.188 22.05591              1
5002      50.01 1669.250 22.10432              1
...
5248      52.47 1600.500 34.05493              1
5249      52.48 1603.370 34.11644              1
5250      52.49 1610.750 34.17795              1
 [ reached 'max' / getOption("max.print") -- omitted 110473 rows ]

The new dataset has 110k rows remaining, there was quite a bit of coasting or idling in this data set.

Finally, we have the data prepared and I can generate a plot. In this example, I'm giving a title to the graph, instructing on how I want my x and y axis to be named and what limits and breaks to use on them. Then, I overlay a scatter plot (geom_point) and tell x axis should represent the speed whily y should be rpm.
Code:
> ggplot() +
+     ggtitle("RPM vs speed") +
+     scale_y_continuous(name = "RPM", limits = c(0, 4000), breaks = seq(0, 5000, 1000)) +
+     scale_x_continuous(name = "speed", limits = c(0, 140), breaks = seq(0, 140, 20)) +
+     geom_point(data = my_data2, mapping = aes(x = speed, y = rpm), color = 'darkcyan')

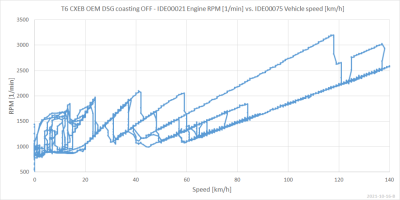
As a result, I will get a plot like below. The gears can be pretty well seen except the 1st is little bit mushy. I have DSG TVS mapping, would be interesting to compare a similar plot for non-TVS -mapped box :whistle:

1687683805378.png
While RStudio and ggplot2 are really nice, they don't quite shine in plotting multiple signals in the same graph. In data science world, which these tools are really created for, multiple axis is considered confusing [5]. So, there's no easy way to add eg couple of digital signals on top / under a plot, separate plots must be created. That's quite a shame and probably means the search for ultimate plotting tool continues - but definitely RStudio is a valuable addition to the arsenal.
1687683940433.png

[1] Posit
[2] API — asammdf "7.3.12" documentation
[3] GitHub - tidyverse/readr: Read flat files (csv, tsv, fwf) into R
[4] GitHub - tidyverse/ggplot2: An implementation of the Grammar of Graphics in R
[5] Why not to use two axes, and what to use instead
 
Last edited:
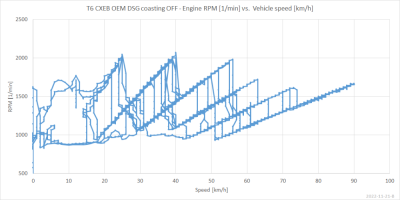
The coasting was obviously on?

View attachment 203387

I think you either had coasting off or filtered - at least mine looked like this without filtering. And yes, I use coasting all the time and don't bother turning it off ever. The graph is not too bad, gearing can still be seen but it's just not quite as clean.

Thanks for the plot! The TVS effect can clearly be seen - mine goes up to 2.5k before shifting up whereas yours shifts by 2k, at least up to 4th. Also, mine doesn't run much at all under 1.5k so it's also little bit more aggressive on downshifting

1687690220340.png
 
Last edited:
I think you either had coasting off
Yes, I have coasting off - thus no need to use brakes :whistle:

whereas yours shifts by 2k, at least up to 4th.
Ahhh, that's a bit poor plot for conclusions - it was a motorway run. I guess requested torque needs to be factored in.

Anyways, below a bit more typical driving profile for me - only feathering the accelerator. Rarely above 2000 RPM. And, actually gears can stay engaged even down to 1000 RPM - when using engine braking to save brake pads.

1687697290376.png
 
Ahhh, that's a bit poor plot for conclusions - it was a motorway run. I guess requested torque needs to be factored in.

Sure, mine wasn’t any kind of test either, just a normal run. Still, I drove the van before TVS and although I didn’t log any data that’s pretty much exactly my experience - it would always shift up by 2k unless absolutely floored like nobody does in everyday driving.

Anyways, below a bit more typical driving profile for me - only feathering the accelerator. Rarely above 2000 RPM. And, actually gears can stay engaged even down to 1000 RPM - when using engine braking to save brake pads.

View attachment 203396
I use engine braking a lot as well. That would have been filtered from above sample as I filtered by accelerator and unfiltered is too messy to tell the difference. I just tap the paddle downshifter from coasting if I want engine braking.
 
I've been stepping up my query load from CANEdge. There's good news and bad news:

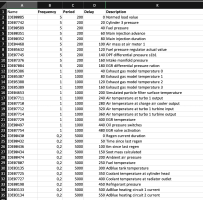
The good news is that so far it works beautifully. I've set up sort of layered query model by which I can add bunch of PID's at 5hz, 1hz or 0.2hz. This is my current PID setup, fairly moderate still but goes to show querying works and what kind of "always on" data collection I'm after:

1688582809709.png


That's probably not the final PID selection, anyway some reasoning is that most of temperature measurements can be 1hz or less, they're not going to change that fast. And some PIDS such as regen stats can be easily dropped to queried only every 5 seconds and it still will catch the essential.

I've attached a good test run with above PID set as an excel sheet. I didn't normalise the timestamps so each metric has separate timestamps - the intention here was to check that the timing works and samples are actually generated in their desired frequencies and that there's no data loss. All good on that front, it seems. I also added rpm from the "given" metrics from drivetrain bus, that one I donwsampled to 0.1s simply because it would have had too much rows otherwise.

The bad news is my CarScanner stopped working while I had the above query load running :eek:. I think it's because CAN gateway copies all the 7E8 responses to the diagnostic port.. so there we have the poor Carista dongle and Bluetooth connection to the CarScanner application trying to cope with messages they didn't ask for... and they didn't seem to appreciate the free data they got, ungrateful things. Bugger. I'm not sure how to solve this one, and I'm not sure if I'm willing to live without the real time comfort the simple but essential dashboard has brought me.

ERRATA: replaced attached excel sheet with a new version, I had a copy-paste error in DBC file leading to coolant_temperature_at_cylinder_head and coolant_temperature_at_radiator_outlet to contain the same data
 

Attachments

  • 2023-07-05-test-canedge2-repeated-queries.xlsx
    1.9 MB · Views: 6
Last edited:
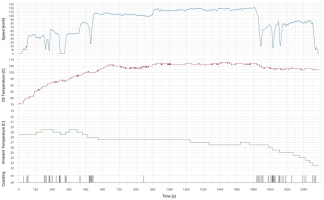
Little bit of R -plotting work continued in a search of best possible plots.

This is the current "state of art" time series plots I can produce - still no overlaying signals but getting them stacked works quite nicely and produces rather clear and high quality plots, usable for many purposes as is.

Also tried R notebooks for the first time, that just means the source code of the plot can be annotated with text and it will produce HTML output. For example, this particular notebook I published in Amazon S3 as Time series data plotting. Also the notebook itself is fully text format so it's kind of easy to share and collaborate on by many authors.

1689864735325.png
 
Back
Top